Thursday, April 15, 2010
Google Maps: UCLA Disc Golf Course 18-Holes
View UCLA Disc Golf Course 18-holes in a larger map
Neogeography is bringing the world of spatial information to the masses in a very convenient and accessible light. Maps can be a very personal entity, centric to the creator's experiences. In order to convey these experiences to others, neogeography has become a valuable tool. While neogeography presents several positive possibilities, there is also a downside.
Maps are information, and information is power. The negative aspect of user created maps is misleading and faulty information being set forth to uninformed viewers. Misleading information can lead to potentially severe consequences. Several bias can enter the world of user created maps; both intended and unintended. One must be careful in checking the credibility of the source before putting full trust in the conveyed information.
And with that, please enjoy my map of UCLA's student created 18-hole disc golf course!
Wednesday, April 14, 2010
Beverly Hills Topo Map
1. What is the name of the quadrangle? Beverly Hills Quadrangle
2. What are the names of the adjacent quadrangles? Canoga Park, Van Nuys, Burbank, Topanga, Venice, Inglewood
3. When was the quadrangle first created? 1927
4. What datum was used to create your map? National Geodetic Vertical Datum of 1929
NOS/NOAA chart 18744, North American Datum of 1927 (NAD 27), NAD 83,
5. What is the scale of the map? 1:24 000
6. At the above scale, answer the following:
a) 5 centimeters on the map is equivalent to how many meters on the ground? 120 meters
b) 5 inches on the map is equivalent to how many miles on the ground? 1.89 miles
c) one mile on the ground is equivalent to how many inches on the map? 2.645 inches
d) three kilometers on the ground is equivalent to how many centimeters on the map? 12.5 cm
7. What is the contour interval on your map? 20 feet
8. What are the approximate geographic coordinates in both degrees/minutes/seconds and decimal degrees of:
a) the Public Affairs Building; 34 º4’28.8”N and 118º26’21.24”W / 34 º0.0746’ and 118º0.439’
b) the tip of Santa Monica pier; 34 º00’54.8”N and 118 º30’3.6” / 34 º 0.09133’ and 34 º0.5006’
c) the Upper Franklin Canyon Reservoir; 34 º0.0967’ 118 º0.412’
9. What is the approximate elevation in both feet and meters of:
a) Greystone Mansion (in Greystone Park); 600 m / 1968.5 ft.
b) Woodlawn Cemetery; 40 m / 131.2 ft.
c) Crestwood Hills Park; 500 m / 1640 ft.
10. What is the UTM zone of the map? Zone 11
11. What are the UTM coordinates for the lower left corner of your map? 3763 362
12. How many square meters are contained within each cell (square) of the UTM gridlines? 1000 m2
13. Obtain elevation measurements, from west to east along the UTM northing 3771000, where the eastings of the UTM grid intersect the northing. Create an elevation profile using these measurements in Excel (hint: create a line chart). Figure out how to label the elevation values to the two measurements on campus. Insert your elevation profile as a graphic in your blog.
14. What is the magnetic declination of the map? 14 º East
15. In which direction does water flow in the intermittent stream between the 405 freeway and Stone Canyon Reservoir? South
16. Crop out (i.e., cut and paste) UCLA from the map and include it as a graphic on your blog.
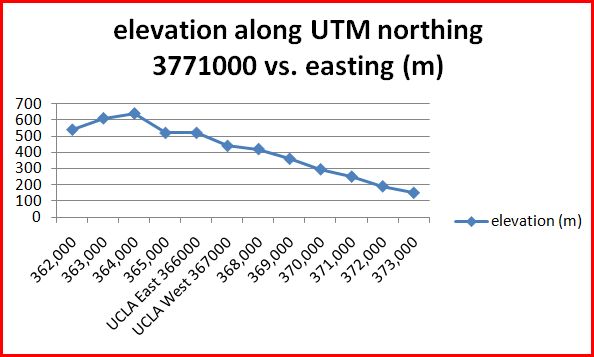


| POINTS (UTM) | elevation (m) |
| 362,000 | 540 |
| 363,000 | 610 |
| 364,000 | 640 |
| 365,000 | 520 |
| UCLA East 366000 | 520 |
| UCLA West 367000 | 440 |
| 368,000 | 420 |
| 369,000 | 360 |
| 370,000 | 295 |
| 371,000 | 250 |
| 372,000 | 190 |
| 373,000 | 150
|

Thursday, April 1, 2010
Lab 1: Awesome Maps

 The above maps, created by the National Resource Conservation Service, show the distribution of different soils throughout the US and the world. Each of the 14 different colors indicate a different type of dominant soil order. There are over 40,000 different types of soils in the world! The map of the US is interesting because the large green area in the middle indicates the extent of a very important soil called a mollisol. It is a highly fertile grassland soil and the reason the midwest is known as the breadbasket of America. Both of these maps are important for understanding the distribution of soils from a small to larger scale. This knowledge becomes increasingly important when applied to other environmental factors. (source: http://soils.usda.gov/use/worldsoils/mapindex/index.html)
 This map, created by the U.S. Geological Survey, illustrates the baythemtry of Santa Monica Bay. The Santa Monica Submarine Canyon and Redondo Submarine Canyon are major mechanisms of sedimentation loss within the region. This map is interesting because it give spatial perspective on the size and depth of the submarine canyons. The lines are further apart in the Santa Monica Canyon indicating a low gradient decline over a longer distance, while the Redondo Canyon shows a rapid decline in sea floor elevation.
(source: http://www.mbari.org/news/homepage/2005/socal-canyons.html)
 The Disneyland California map depicts the happiest place on earth! It is purely landmark based. The use of color and pictorial representation of points of interest create the content of the map. The significance of North and South are instantly diminished and spatial relationship between attractions become the measure of direction. This map interests me because Disneyland played a large role in my childhood and is a great example of a place where a mental map would be based purely on sensory experience. (source: http://www.disneydreamer.com/disneyland/sounds.htm)


Subscribe to:
Posts (Atom)