The most ethnically diverse regions are expressed by the darkest pink. The states containing counties with the highest diversity are California, Washington, New Mexico, Texas, Colorado, Florida, Kansas and Idaho. The majority of the diversity is on the West Coast. The East Coast has a low percentage of diversity.
The vast majority of the Black population is concentrated in the southern states. The ethnic group tends to live closely together in very specific regions and the percentages slowly dissipate as the distance away increases. The Midwest has a very low percentage of Blacks and the West Coast has a slightly higher percentage then the Midwest. California in particular has about 16-31% Blacks in some counties.
Asians are more widely dispersed then the Black populations. High concentrations exist in California, Washington and a few counties on the Eastern Coastline. Asians appear to be relatively intermixed with the other ethnic populations on a national level. The significantly higher coastal populations are likely due to immigration patterns.
Mt. Vernon is in Northern California, about 30 miles north of Sacramento. It is a small mountain in the middle of the valley in Sutter County. The geographic coordinate system reveals that that cell size (x,y) is (27.54633136, 27.54633136. The extent is:
Extent Top - 4351369.27031 Bottom - 4332472.487 Left - 593142.05708 Right- 612479.581698
ArcGIS is a very complex piece of software with several advantages as well as disadvantages. The tutorial was helpful in walking through a cursory step by step process of a relatively involved map. The five exercises were fairly easy to walk through with only a few hiccups along the way. The overall challenge was highly educational in terms of understanding how the different layers of a map work and how to use the various tools.
Some advantages of using ArcGIS are being able to create very thorough maps which convey a lot of information to the reader. Little details within the program are geared towards making the actual reading of the map as user friendly as possible. For instance the legend, scale bar and compass rose are all nice touches. The feature making it easy to align and resize makes the map neat. Renaming the items in the table of contents immediately reflects on the legend. The ability to make graphs helps explain the significance of the map in concise way.
The disadvantages of ArcGIS are that the actual program is not user friendly at all. The entire feel of the program is old and outdated. While it has the capability of processing enormous amounts of information, the program is fickle and convoluted. ArcGIS needs a 2010 makeover. A facelift if you will, this isn’t 1998.
The biggest difficulty that I ran into was file management. ArcGIS becomes very confused when files are saved in different places and it creates a hole of unlinked information in your project. After trial and error I was finally able to consolidate all of my files into a thumb drive. The slightest slip up in saving location can render all of your work unusable.
This exercise was a really great first introduction into the world of ArcGIS. Practice makes perfect or several all nighters in a row, whichever comes first.
Neogeography is bringing the world of spatial information to the masses in a very convenient and accessible light. Maps can be a very personal entity, centric to the creator's experiences. In order to convey these experiences to others, neogeography has become a valuable tool. While neogeography presents several positive possibilities, there is also a downside.
Maps are information, and information is power. The negative aspect of user created maps is misleading and faulty information being set forth to uninformed viewers. Misleading information can lead to potentially severe consequences. Several bias can enter the world of user created maps; both intended and unintended. One must be careful in checking the credibility of the source before putting full trust in the conveyed information.
And with that, please enjoy my map of UCLA's student created 18-hole disc golf course!
1. What is the name of the quadrangle? Beverly Hills Quadrangle
2. What are the names of the adjacent quadrangles? Canoga Park, Van Nuys, Burbank, Topanga, Venice, Inglewood
3. When was the quadrangle first created? 1927
4. What datum was used to create your map? National Geodetic Vertical Datum of 1929
NOS/NOAA chart 18744, North American Datum of 1927 (NAD 27), NAD 83,
5. What is the scale of the map? 1:24 000
6. At the above scale, answer the following:
a) 5 centimeters on the map is equivalent to how many meters on the ground? 120 meters
b) 5 inches on the map is equivalent to how many miles on the ground? 1.89 miles
c) one mile on the ground is equivalent to how many inches on the map? 2.645 inches
d) three kilometers on the ground is equivalent to how many centimeters on the map? 12.5 cm
7. What is the contour interval on your map? 20 feet
8. What are the approximate geographic coordinates in both degrees/minutes/seconds and decimal degrees of:
a) the Public Affairs Building; 34 º4’28.8”N and 118º26’21.24”W / 34 º0.0746’ and 118º0.439’
b) the tip of Santa Monica pier; 34 º00’54.8”N and 118 º30’3.6” / 34 º 0.09133’ and 34 º0.5006’
c) the Upper Franklin Canyon Reservoir; 34 º0.0967’ 118 º0.412’
9. What is the approximate elevation in both feet and meters of:
a) Greystone Mansion (in Greystone Park); 600 m / 1968.5 ft.
b) Woodlawn Cemetery; 40 m / 131.2 ft.
c) Crestwood Hills Park; 500 m / 1640 ft.
10. What is the UTM zone of the map? Zone 11
11. What are the UTM coordinates for the lower left corner of your map? 3763 362
12. How many square meters are contained within each cell (square) of the UTM gridlines? 1000 m2
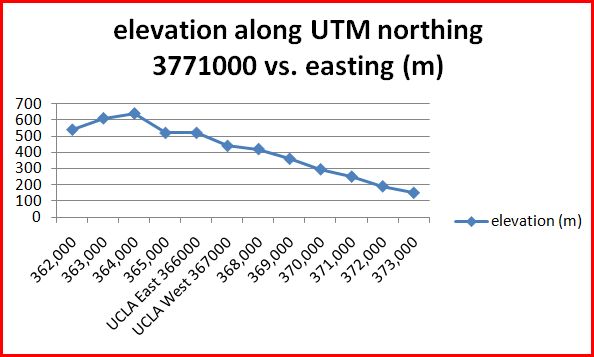
13. Obtain elevation measurements, from west to east along the UTM northing 3771000, where the eastings of the UTM grid intersect the northing. Create an elevation profile using these measurements in Excel (hint: create a line chart). Figure out how to label the elevation values to the two measurements on campus. Insert your elevation profile as a graphic in your blog.
14. What is the magnetic declination of the map? 14 º East
15. In which direction does water flow in the intermittent stream between the 405 freeway and Stone Canyon Reservoir? South
16. Crop out (i.e., cut and paste) UCLA from the map and include it as a graphic on your blog.

.jpg)